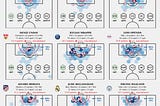
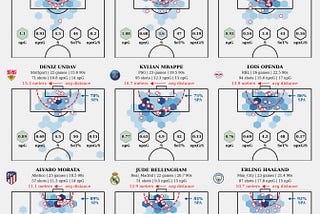
Plot Shots & Goals Maps with Python & MplSoccer. Ranking Players by xG, Shots, and Goals per 90.Step-by-Step Guide to Creating Comprehensive Shots and Goals Maps and Analyzing Player PerformanceMar 18, 2024Mar 18, 2024
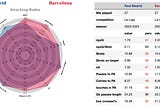
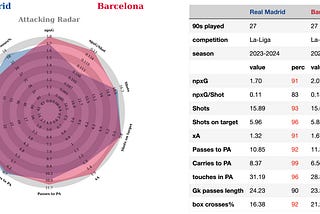
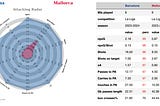
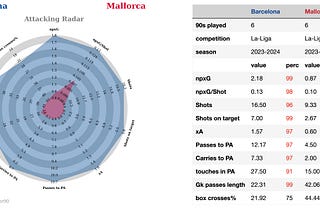
Create a StatsBomb-Inspired Template for Team Radar Comparison Using Free Data from FBRefStep-by-Step Guide: How to Easily Build Comprehensive Radars Using Python and FBRef DataMar 7, 2024Mar 7, 2024
Bundesliga Through the Prism of xT Metric: The Phenomenal Wirtz and Bynoe-Gittens.Bundesliga’s Tactical Landscape: Ranking Teams and Players Through Expected Goals and Threat VisualizationMar 1, 2024Mar 1, 2024
A Detailed Guide to Creating Advanced Pass Maps with Python and MatplotlibDelving into Advanced Pass Map Creation with an Extra Layer on a Refined TemplateFeb 22, 20241Feb 22, 20241
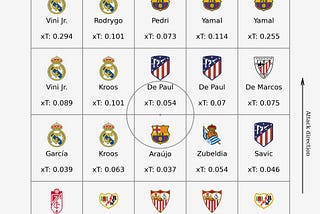
Exploring La Liga Through the Lens of xT Metric: Barcelona and Real Madrid’s Dominance, De Paul’s…Investigating the Efficiency of Passes and Movements Among La Liga Teams and Players Through the Lens of the Expected Threat Metric.Feb 17, 2024Feb 17, 2024
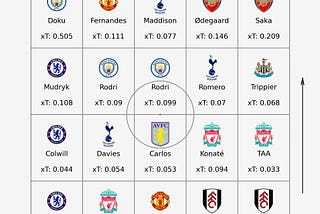
Exploring the Best EPL Creators by xT: A Zone-by-Zone AnalysisIt’s evident that we are witnessing an exciting championship race in the English Premier League. Moreover, within one of the teams…Feb 11, 20241Feb 11, 20241
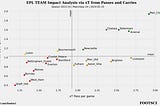
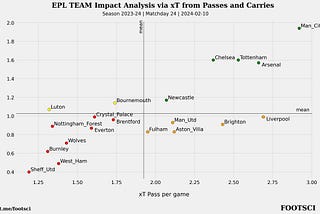
Behind the EPL Scenes: Quick Analysis Using xT Metric and Football Event DataIn today’s analysis, we delve into the ratings of the best EPL players, leveraging the Expected Threat (xT) metric. To simplify, we can…Feb 10, 2024Feb 10, 2024
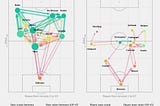
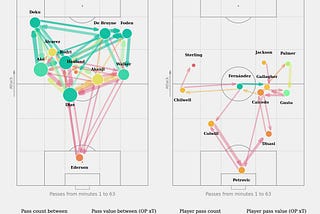
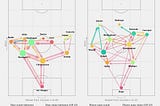
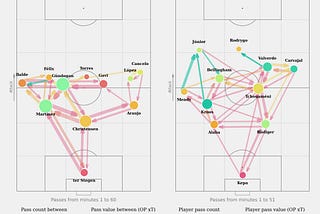
Passing networks with expected threat (xT) layer.In this article, we’ll explore the passing network map, also known as a pass map, which is a visual representation of successful passes…Jan 9, 20242Jan 9, 20242
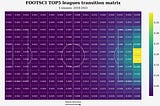
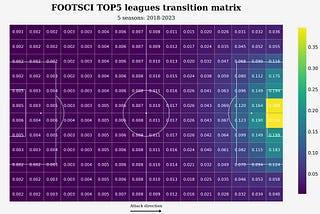
Summary by Expected Threat (xT). Important details about transition matrix.Consider nuances of calculating xT and have a look on the best European players.Jan 6, 2024Jan 6, 2024
La Liga teams radars and xG diff dynamics. Almeria anomaly. Matchday 7.La Liga preview.Sep 27, 2023Sep 27, 2023